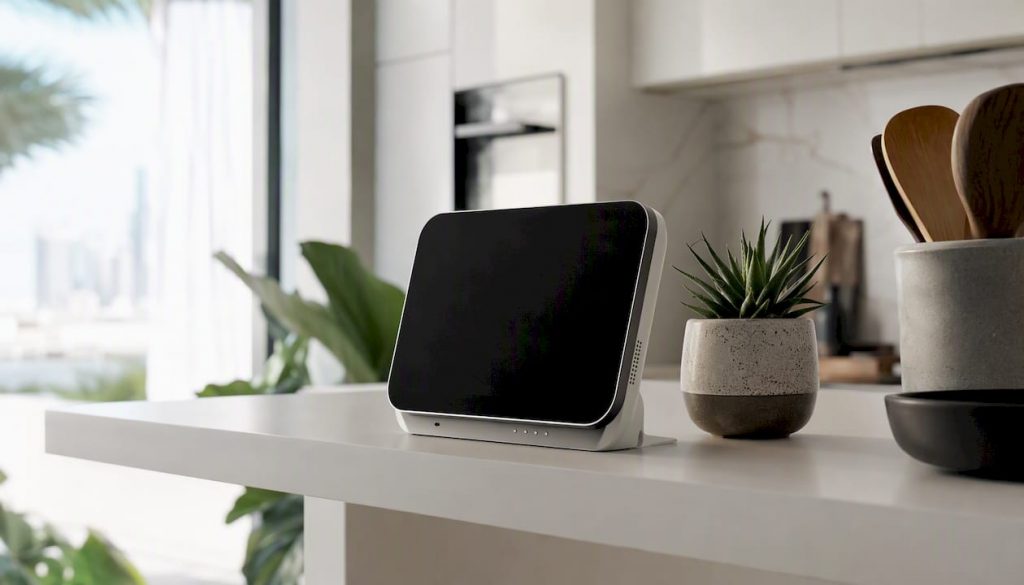
A digital air quality monitor is an electronic sensor device that measures specific indoor pollutants and environmental conditions, then displays the results in real time so you can take immediate, informed action. Where older analogue gauges gave a single static reading, modern monitors track multiple parameters simultaneously, log trends over time, and often send alerts to your phone when levels rise. The practical outcome is straightforward: you know what is in the air you are breathing, and you know when to open a window, run a purifier, or leave a room.
Common scenarios where this matters include noticing a PM2.5 spike while frying on a gas stove, confirming that your bedroom ventilation is adequate overnight, or detecting a CO2 build-up during a crowded meeting. Peer-reviewed research shows that pairing air quality information with clear behavioural guidance can reduce exposures and some associated health events, which is why the data a monitor provides is only useful when you act on it.
The most common parameters a digital air quality monitor reports include:
- PM2.5 and PM10 (fine and coarse particulate matter)
- CO2 (carbon dioxide, a proxy for ventilation adequacy)
- tVOCs (total volatile organic compounds from cleaning products, furniture, and paints)
- HCHO (formaldehyde, common in new furniture and building materials)
- Temperature and relative humidity
- Some models also report NO2 or O3 (nitrogen dioxide and ozone)
Key takeaways
A digital air quality monitor gives you real-time data on indoor pollutants, but its value depends entirely on pairing those readings with clear corrective actions.
| Point | Details |
|---|---|
| What it measures | PM2.5, CO2, tVOCs, HCHO, temperature, and humidity are the core parameters; not all monitors cover every pollutant. |
| When it helps most | Wildfire smoke events, cooking on gas, new furniture off-gassing, and poorly ventilated bedrooms are the highest-value use cases. |
| Accuracy limits | Sensor drift, humidity effects, and placement errors affect readings; use monitors for relative changes and trend detection, not absolute precision. |
| Buying priorities | Match sensor types to your concern (OPC for PM, NDIR for CO2), confirm connectivity and calibration options, and check local warranty support. |
| Climatepro’s role | After diagnosing a problem with a monitor, Climatepro’s HEPA purifiers, humidifiers, and dehumidifiers provide the corrective step. |
Table of Contents
- What does a digital air quality monitor actually measure?
- How does an air quality monitor work?
- How accurate are digital air quality monitors?
- How do you interpret air quality monitor readings?
- Do air quality monitors really work?
- How to choose a digital air quality monitor
- When does a monitor help most, and what should you do when readings are high?
- The gap between monitoring and actually improving your air
- Monitoring tells you the problem; Climatepro helps you fix it
- Sources
What does a digital air quality monitor actually measure?
The parameters a monitor reports determine its practical value. Not every device covers every pollutant, so understanding what each metric indicates helps you choose the right tool.
| Parameter | What it indicates | Common indoor sources |
|---|---|---|
| PM1 / PM2.5 / PM10 | Fine to coarse airborne particles | Cooking, candles, wildfire smoke, traffic ingress |
| CO2 | Ventilation adequacy | Occupant breathing, poor airflow |
| tVOCs | Broad chemical vapour load | Cleaning products, paints, adhesives, new furniture |
| HCHO (formaldehyde) | Specific off-gassing chemical | Pressed-wood furniture, flooring, insulation |
| NO2 / O3 | Combustion gases and oxidants | Gas stoves, outdoor traffic, some air purifiers |
| Temperature | Thermal comfort and sensor context | Heating, cooling, solar gain |
| Relative humidity | Moisture level; mould and dust-mite risk | Cooking, bathing, outdoor air ingress |
Scientific literature documents measurable indoor exposures to particulate matter and gases from cooking, traffic ingress, and building materials, which supports the practical case for monitoring these parameters at home.
A few important coverage limits apply. Most consumer monitors do not detect radon, carbon monoxide (CO), or specific individual VOCs beyond a broad tVOC index. For CO specifically, Consumer Reports testing notes that dedicated CO detectors remain the safer choice because air quality monitors are not designed or certified for that purpose. The US EPA makes the same point: low-cost monitors can provide useful information on certain pollutants, but they cannot measure every pollutant and should not be treated as a complete picture of indoor air quality on their own.
Multi-metric monitors that include PM, CO2, and VOC readings alongside a clear display and app tend to be most useful for typical home users wanting to spot issues and track trends over time.
How does an air quality monitor work?
Different pollutants require different detection methods. Most consumer-grade air quality monitoring devices combine two or three sensor technologies in a single unit, and understanding a commercial energy audit process can help when integrating environmental monitoring into building-scale efficiency projects.
-
Optical particle counters (OPC) use a laser beam to detect particles as they pass through a sensing chamber. When a particle scatters the laser light, a photodetector records the event. The device counts and sizes these scattering events to estimate concentrations across size bins: PM1, PM2.5, and PM10. Accuracy depends on particle composition and density, which is why smoke particles and dust particles of the same physical size can produce different readings.
-
NDIR (non-dispersive infrared) sensors measure CO2 by passing infrared light through a sample of air and detecting how much is absorbed at the wavelength CO2 absorbs. NDIR is generally more reliable for CO2 than sensors that infer CO2 indirectly from tVOC readings, because the indirect method is sensitive to other gases and tends to drift more quickly.
-
MOS (metal oxide semiconductor) and electrochemical sensors detect VOCs and some gases by measuring changes in electrical resistance or current when target molecules contact the sensor surface. MOS sensors are inexpensive and sensitive but prone to cross-sensitivity (responding to non-target gases) and drift over months of use.
Beyond the sensors themselves, connectivity components shape how you access the data. Most monitors include an on-device display showing current readings. Many also connect via Bluetooth or Wi-Fi to a smartphone app or cloud dashboard, where you can review historical trends, set custom alerts, and export data. IoT-based sensor networks extend this further, linking multiple devices across a building or neighbourhood for near-real-time, spatially dense coverage at lower cost than reference-grade instruments.
Pro Tip: Placement affects readings significantly. Position your monitor at breathing height (roughly 1–1.5 metres), away from direct sunlight, cooking surfaces, and air vents. A monitor sitting directly above a stove will read high during cooking regardless of the rest of the room’s air quality. Keep the device’s internal fan and inlet clear of dust, and check the manufacturer’s guidance on cleaning intervals.
How accurate are digital air quality monitors?
Accuracy varies considerably across sensor types, price points, and operating conditions. Understanding the main failure modes helps you set realistic expectations.
Several factors reduce measurement accuracy:
- Humidity and temperature extremes affect optical particle counters (water droplets scatter laser light like particles) and MOS sensors (resistance changes with moisture).
- Particle composition matters for OPCs: smoke from a gas stove and construction dust of the same aerodynamic size produce different scattering signals, so the device’s conversion algorithm may over- or under-report.
- Sensor ageing and drift are particularly relevant for MOS VOC sensors, which can shift their baseline over months. Reviews of indoor air monitoring methods highlight sensor drift as a key data-quality concern and recommend periodic collocation against reference monitors to maintain reliability.
- Crowding effects occur when particle concentrations are very high (heavy wildfire smoke, for example), causing multiple particles to pass through the laser beam simultaneously and producing undercounts.
- Placement errors such as proximity to vents, walls, or direct sunlight introduce systematic bias.
IoT sensor networks address some of these issues through cloud-based calibration algorithms and hybrid approaches that anchor low-cost sensors to nearby reference-grade stations. Consumer devices rarely have access to this infrastructure, so their accuracy is more variable.
Practical calibration and verification steps:
- Compare against a trusted local reference. Some Australian state environment agencies publish real-time reference monitor data. Running your device alongside a published station reading for a few days gives a useful baseline check.
- Run a controlled test. Boil water in the same room and watch the humidity and PM readings respond. Light a candle briefly and confirm the PM2.5 reading rises. These simple checks confirm the sensors are responding, even if they do not verify absolute accuracy.
- Collocation guidance. Placing two consumer monitors side by side and comparing their readings over 24–48 hours reveals unit-to-unit variability. If they agree within roughly 10–20%, both are likely functioning normally.
Pro Tip: Consumer monitors are most reliable for detecting relative changes and episodic spikes rather than absolute concentrations. Use them to identify when something has changed (a cooking event, a new piece of furniture off-gassing, a wildfire smoke day) and to verify that a corrective action (opening a window, running a purifier) has brought levels down.
How do you interpret air quality monitor readings?
Raw numbers from a monitor are only useful if you know what they mean. The Air Quality Index (AQI) is the standard framework for translating pollutant concentrations into health-relevant categories.
AQI converts a measured concentration into a dimensionless index value, then maps that value to a colour-coded health band: Good, Moderate, Unhealthy for Sensitive Groups, Unhealthy, Very Unhealthy, and Hazardous. Each band carries a recommended action. The index is calculated separately for each pollutant, and the overall AQI for a given reading is the highest single-pollutant value.
The PLOS Digital Health systematic review found that most digital air quality channels use AQI formats and report PM2.5 prominently, but that clear exposure-reducing health messaging is often limited. This gap matters: knowing a number is “unhealthy” is less useful than knowing to close windows, run a HEPA purifier, or reduce the source activity.
In Australia, the Department of Climate Change, Energy, the Environment and Water publishes air quality data and guidance, and state environment agencies (such as the NSW EPA and EPA Victoria) maintain real-time monitoring networks. WHO guideline values for PM2.5 are more stringent than many national standards, so checking both your device’s index and local government guidance gives a fuller picture.
One important caution: different devices and apps use different index scales. Some use the US EPA AQI, others use a proprietary scale, and a few use the European CAQI. Always check your device’s documentation to confirm which index it applies, because the same raw PM2.5 concentration can map to different colour bands depending on the scale used.
Do air quality monitors really work?
The honest answer is: yes, within specific limits. Understanding both sides helps buyers set correct expectations.
Advantages:
- Real-time awareness of episodic events (cooking, candle burning, wildfire smoke days) that would otherwise go unnoticed.
- Trend logging that reveals chronic patterns, such as CO2 building up overnight in a sealed bedroom.
- Validation of corrective measures: you can confirm that opening a window or running a purifier actually reduces pollutant levels.
- Motivation to change behaviour when readings are visibly high.
Disadvantages and limits:
- Sensor accuracy varies widely between models and degrades over time without recalibration.
- Limited pollutant coverage: most consumer devices do not detect radon, CO, or individual VOC species.
- False reassurance is a real risk. A monitor showing “Good” for PM2.5 says nothing about radon or CO levels.
- Cost considerations: a capable multi-sensor monitor costs more than a basic single-parameter device, and the cheapest options often have the least reliable sensors.
Consumer Reports testing confirms wide variability between monitors’ measurements and feature sets, with the highest-rated models reliably detecting PM2.5 spikes and providing clear displays and alerts, while only some also detect VOCs or gases. The US EPA reinforces this: low-cost monitors help users identify when to take action, but they should not be relied on as the sole indicator of health risk.
For readers on a tight budget, Wired makes a practical point worth noting: a purifier often provides more immediate protective benefit than a monitor, because a monitor diagnoses problems while a purifier removes them.
How to choose a digital air quality monitor
The right monitor depends on your specific concern, your space, and how you plan to use the data. A structured approach avoids paying for sensors you do not need or missing the one that matters most.
Step 1: Identify your main concern.
Are you worried about wildfire smoke (prioritise PM2.5 OPC sensor), poor ventilation in a bedroom or office (prioritise NDIR CO2), new furniture off-gassing (prioritise HCHO and tVOC), or high humidity contributing to mould risk (prioritise humidity sensor)?
Step 2: Match sensor types to your concern.
For particulate matter, look for an optical particle counter (OPC) rather than a basic photoelectric sensor. For CO2, confirm the device uses NDIR technology. For VOCs, MOS sensors are standard but check whether the device distinguishes HCHO separately, as formaldehyde is a specific health concern.
Step 3: Check calibration and connectivity options.
Does the device support field calibration or cloud-based correction? Can you export data for your own analysis? Wi-Fi connectivity and a cloud dashboard are useful for long-term trend tracking; Bluetooth-only limits you to short-range access.
Step 4: Evaluate display, power, and portability.
A clear on-device display is useful for at-a-glance readings without opening an app. Battery-powered or USB-C devices are easier to reposition for testing different rooms. Mains-only units suit a fixed monitoring point.
Step 5: Confirm warranty, support, and local availability.
Check whether the manufacturer or retailer offers Australian support, replacement sensors, and a warranty of at least 12 months. Firmware updates that improve calibration algorithms are a meaningful long-term benefit.
Key trade-offs to weigh:
- More sensors generally means higher cost and more data to interpret.
- Portability trades off against continuous networked logging.
- Battery life affects how often you need to recharge a portable unit.
For an apartment, a compact multi-sensor device covering PM2.5, CO2, tVOC, and humidity covers the most common concerns. A nursery warrants a monitor with HCHO detection given new furniture and flooring. A shared office benefits from a Wi-Fi-connected unit with CO2 alerts. Near a gas stove, NO2 detection adds meaningful value. For renters wanting placement flexibility, this renter-focused guide covers portability and placement in detail.
When does a monitor help most, and what should you do when readings are high?
Certain scenarios produce the clearest benefit from real-time monitoring. Knowing which situations to watch for, and what to do when levels rise, turns data into protection.
Scenarios where monitors are especially useful:
- Wildfire smoke events: PM2.5 can spike rapidly from outdoor ingress even with windows closed. A monitor confirms whether your indoor levels are rising and whether a purifier is keeping up.
- Cooking on a gas stove: Gas combustion produces NO2 and CO2; frying and grilling produce PM2.5. Levels can reach unhealthy concentrations within minutes in a closed kitchen.
- Newly furnished rooms: Fresh pressed-wood furniture, flooring, and adhesives off-gas formaldehyde and tVOCs for weeks to months. A monitor with HCHO detection shows when levels are elevated and when they have normalised.
- Poorly ventilated bedrooms: CO2 accumulates overnight when a room is sealed. Readings above 1,500 ppm are associated with reduced sleep quality and cognitive performance the following morning.
- High-traffic commute routes: Homes near busy roads can experience PM2.5 ingress during peak traffic hours, which a monitor can confirm and help you time ventilation around.
What to do when readings rise:
- Open windows or increase mechanical ventilation to dilute pollutants with fresh outdoor air, provided outdoor air quality is acceptable (check your state EPA’s real-time data first).
- Reduce or remove the source. Turn on the range hood, extinguish candles, move new furniture to a ventilated space, or reduce occupancy.
- Run a HEPA air purifier and watch the monitor to confirm PM2.5 is falling. If levels do not drop within 20–30 minutes, check filter condition and room sizing.
- Vacate if levels are hazardous. PM2.5 above 150 µg/m³ or CO2 above 5,000 ppm warrants leaving the space until the source is resolved.
- Log the event and look for patterns. Repeated spikes at the same time of day often point to a fixable source.
Research published in NCBI supports the value of combining air quality information with clear behavioural guidance: the combination reduces exposures and some health events more effectively than data alone. The PLOS Digital Health review reinforces this, noting that most digital AQ channels present an AQI but often omit the specific actions that would make the data useful.
Pro Tip: Use your monitor to validate purifier performance directly. Place the monitor in the same room as the purifier, note the PM2.5 reading before switching it on, then check again after 20 minutes. If the reading has not dropped meaningfully, the purifier may be undersized for the room, the filter may need replacing, or the unit’s airflow is being obstructed. For guidance on using a monitor to verify purifier effectiveness, the practical steps are straightforward.

The gap between monitoring and actually improving your air
Most people who buy a digital air quality monitor are surprised by what they find in the first week. CO2 peaks during family dinners. PM2.5 spikes every time someone fries food. A newly furnished spare room reads elevated tVOCs for a month. The monitor does not cause these readings; it simply makes visible what was always there.
The practical lesson is that monitoring and remediation are two separate steps, and the second one matters more. A monitor that shows persistently high PM2.5 in a bedroom is only useful if it prompts action: a HEPA purifier, better sealing against outdoor ingress, or a change in cooking habits. Without that follow-through, the data is just a number on a screen.
There is also a tendency to over-interpret short-term spikes. A brief PM2.5 rise during cooking, resolved within 15 minutes by ventilation, is a different concern from a baseline that never drops below 35 µg/m³. Trend data over days and weeks is more informative than any single reading, which is why cloud logging and data export matter for serious users.
Monitoring tells you the problem; Climatepro helps you fix it
A monitor diagnoses your indoor air. What you do with that diagnosis determines whether your air actually improves.

Climatepro stocks a curated range of HEPA air purifiers, humidifiers, and dehumidifiers matched to room size and specific concerns, from dust and allergens to humidity control and odour reduction. If your monitor shows persistent PM2.5 above safe thresholds, the Honeywell Air Touch P2 is a practical corrective option for mid-sized rooms. For larger spaces or higher pollutant loads, the Honeywell Air Touch U1 offers greater capacity. If humidity readings are consistently high, the dehumidifier range addresses mould and dust-mite risk directly. Browse the full air purifier catalogue to match a unit to your room size and then use your monitor to confirm it is working.
Sources
The following sources are worth consulting for deeper guidance, Australian-specific data, and peer-reviewed evidence.
- Systematic technology review of real‑time local air pollution data channels | PLOS Digital Health
- Low–Cost Air Pollution Monitors and Indoor Air Quality | US EPA
- Best indoor air quality monitors of the year | Consumer Reports
- PMCID: PMC8627286 | NCBI
- IoT‑Based Air Quality Monitoring: Pros & Cons, Benefits and Use Cases | Clarity
- Why you need an outdoor air quality monitor | WIRED
This article is general information, not a substitute for advice from a qualified doctor. Consult a qualified healthcare professional about your own circumstances before acting on anything here.