PM2.5 is the finer particle fraction, measuring 2.5 micrometres or less, and it carries the greater health risk because it penetrates deep into the lungs and can enter the bloodstream. PM10, at up to 10 micrometres, mostly settles in the upper airways. The practical takeaway is simple: prioritise filtering PM2.5 indoors with high-efficiency HEPA filtration, since it is the fraction linked most strongly to cardiovascular and respiratory disease.
TL;DR:
- PM2.5 particles are significantly smaller than PM10 and can stay airborne for days, traveling farther and penetrating deeper into the lungs.
- Combustion sources like vehicle exhaust and industrial emissions primarily produce PM2.5, which contains organic carbon and trace metals, unlike mineral dust from sources like construction.
- Indoor PM2.5 levels should be prioritized for filtration, using HEPA H13 or better filters sized appropriately for the room’s volume, to reduce systemic health risks.
- Monitoring is most accurate when using proper placement and maintenance, as optical sensors can misreport during high humidity or near airflow sources, affecting readings.
- Agencies like WHO recommend stricter standards than some national limits, and reducing indoor combustion, dust resuspension, and outdoor infiltration are key actions to lower exposure.
Table of Contents
- PM2.5 vs PM10: what the size difference actually means
- What produces PM10 and PM2.5, and why the composition differs
- How particle size changes what happens inside your body
- Why do PM2.5 and PM10 monitors sometimes show the same reading?
- What do WHO, EPA and CARB consider safe exposure levels?
- How to cut PM2.5 and PM10 exposure inside your home
- The bottom line on PM2.5 vs PM10
- What working with indoor air quality data taught us
- Choosing the right HEPA purifier for PM2.5 and PM10
- Sources
PM2.5 vs PM10: what the size difference actually means
The numbers look small, but the gap between them changes everything about how these particles behave in your body and in the air. PM10 refers to inhalable particles generally 10 micrometres or smaller in diameter, while PM2.5 covers fine inhalable particles generally 2.5 micrometres or smaller. PM2.5 is not a separate category. It is a subset of PM10, meaning every PM2.5 particle also counts as PM10, but not the reverse.
Some comparisons that make the scale tangible:
- A human hair is roughly 50 to 70 micrometres wide, so PM10 particles are about a fifth to a seventh of that width.
- PM2.5 particles are significantly smaller than the width of a human hair.
- Pollen grains typically sit at the coarse end, closer to PM10, while smoke and combustion particles fall well within PM2.5 territory.
The size difference drives behaviour. Coarse PM10 particles settle out of the air within minutes to hours under calm conditions. PM2.5 particles, being lighter and smaller, can stay suspended for days and travel far from their source before settling.
What produces PM10 and PM2.5, and why the composition differs
PM10 is dominated by mechanically generated material: road dust, construction debris, sea spray, and pollen. PM2.5 is largely a combustion byproduct, formed directly from vehicle exhaust, industrial burning, and bushfire smoke, or indirectly through secondary aerosol formation when gases like sulphur dioxide and nitrogen oxides react in the atmosphere.
Typical sources break down roughly like this:
- PM10: construction and demolition dust, unpaved road traffic, agricultural activity, pollen, and mould spores.
- PM2.5: vehicle exhaust, wood and gas combustion, industrial emissions, and secondary aerosols formed from chemical reactions in the air.
CARB notes that composition varies substantially between the two fractions, with PM10 leaning towards mineral dust and biological material, and PM2.5 carrying more organic carbon and trace metals. During dust storms or bushfire events, secondary formation can push the fine fraction’s share of total particulate mass sharply higher.
How particle size changes what happens inside your body
Where a particle lands in your respiratory tract depends almost entirely on its size, and that single variable explains most of the difference in health risk between PM10 and PM2.5. Coarse PM10 particles are mostly trapped in the nose, throat, and upper airways, where mucus and cilia can clear them relatively efficiently. PM2.5 bypasses those defences and travels down into the bronchioles and alveolar sacs, the tiny air pockets where oxygen exchange happens.
PM2.5 is classified by the World Health Organization as posing the greatest risk of any common air pollutant, because its size allows it to penetrate deep into the lung tissue and, from there, potentially enter the bloodstream itself.
Short-term exposure to elevated PM2.5 is associated with asthma flare-ups, coughing, and a measurable rise in emergency department visits for respiratory complaints. Long-term exposure carries heavier consequences. Chronic PM2.5 exposure is linked to ischaemic heart disease, stroke, and chronic obstructive pulmonary disease, conditions that build over years rather than days.
Some groups face disproportionate risk:
- Children, whose lungs are still developing and who breathe more air relative to body size.
- Older adults, particularly those with existing cardiovascular disease.
- People with asthma, COPD, or other chronic respiratory conditions.
- Pregnant people, given links between fine particle exposure and adverse birth outcomes.
A peer-reviewed review of particulate matter health impacts points out that once PM2.5 crosses into the bloodstream, damage tends to be cumulative rather than something the body clears efficiently. That is the core reason fine particle exposure gets treated as a systemic issue, not just a lung issue.
Why do PM2.5 and PM10 monitors sometimes show the same reading?
Air quality monitors use two broad approaches: gravimetric methods, which physically weigh collected particles (the regulatory gold standard but slow), and optical methods, which estimate mass from how particles scatter light (fast, and what almost every consumer monitor uses).
Because PM2.5 is a subset of PM10, the two readings often move together, especially during dust storms or smoke events when fine particles make up a large share of total particulate mass.
- Optical sensors can over-report or under-report depending on particle shape, colour, and composition.
- High humidity often inflates optical readings, because moisture droplets get counted as particles.
- Placement near a window, kitchen, or air vent skews readings away from what you are actually breathing in the room’s centre.
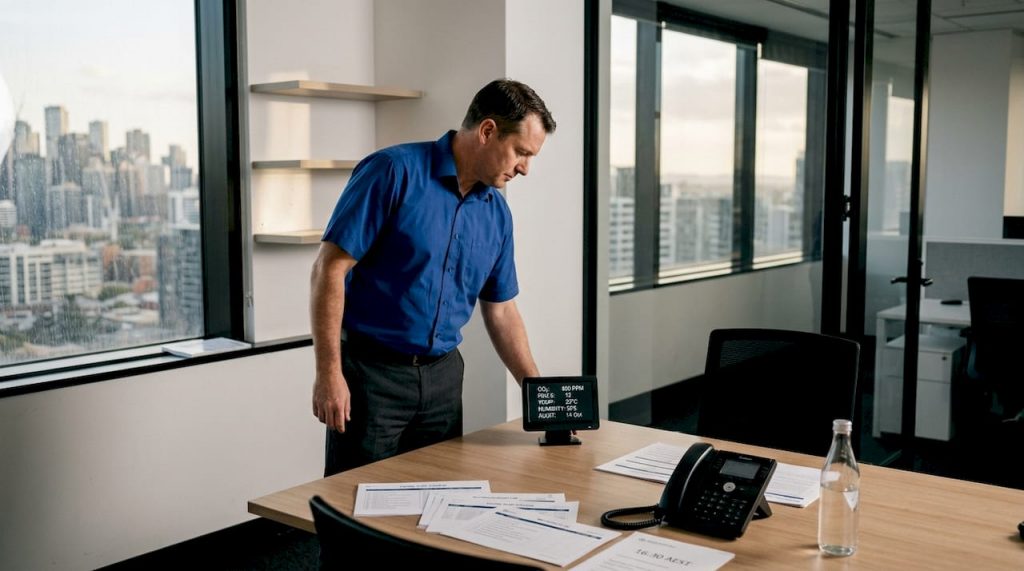
Pro Tip: Place your indoor monitor at roughly seated breathing height, away from direct airflow from vents or open windows, and give it a few minutes to stabilise after any spike before trusting the number.
What do WHO, EPA and CARB consider safe exposure levels?
WHO’s 2021 global air quality guidelines set tighter limits than earlier versions, reflecting evidence that harm occurs even at low concentrations. Agencies then translate those guidelines into enforceable national standards, which is why the numbers you see quoted can vary by jurisdiction.
- WHO’s guideline values distinguish between short-term (24 hour) and long-term (annual) exposure, because a single bad day and constant year-round exposure carry different health implications.
- National standards, including those used by the EPA and California Air Resources Board, set their own PM2.5 and PM10 thresholds, which are often less strict than the WHO guidelines.
- Annual averages matter more for chronic disease risk, while 24-hour spikes matter more for acute symptoms like asthma attacks.
Reading a single day’s air quality figure without checking whether it is a spike or a trend tells you less than it seems to.
How to cut PM2.5 and PM10 exposure inside your home
Reducing exposure comes down to two levers: stopping particles at the source and filtering the air that is left. Both matter, and neither works well alone.
- Cut indoor combustion. Avoid smoking indoors, minimise unflued gas heaters, and use extraction fans when cooking, since frying and grilling generate significant fine particle loads.
- Reduce dust resuspension. Vacuum with a sealed HEPA-filter vacuum rather than a standard one, and damp-dust surfaces instead of dry-dusting, which just redistributes coarse particles into the air.
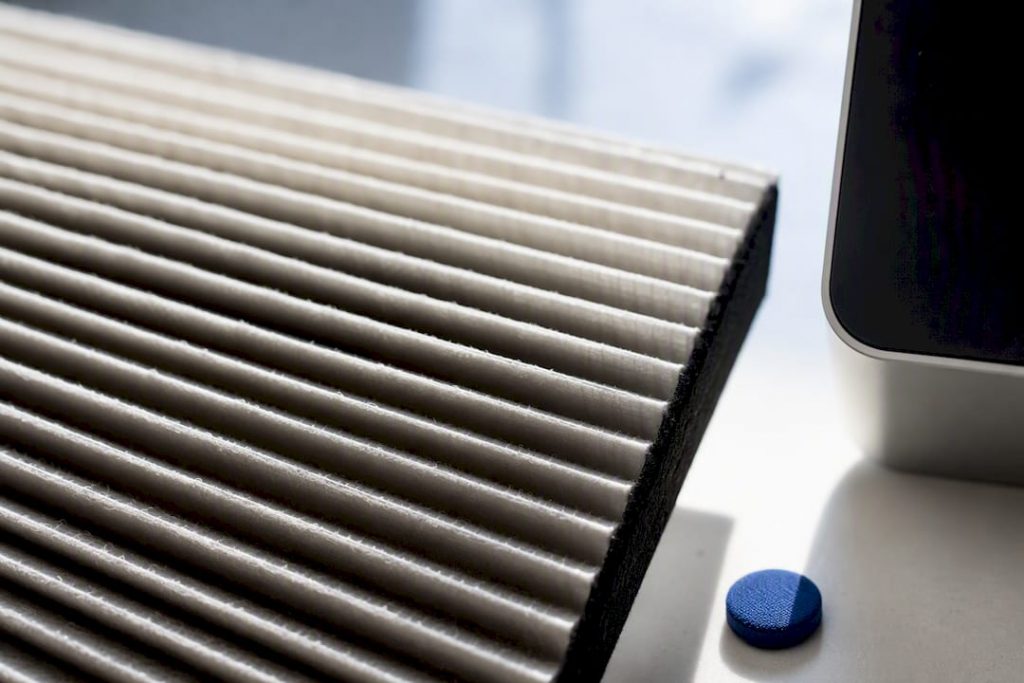
- Filter with the right grade. Look for HEPA H13 or better, which is rated to capture at least 99.95% of particles at the most penetrating size, covering both PM2.5 and PM10 effectively.
- Size the purifier to the room. Match the unit’s Clean Air Delivery Rate (CADR) to your room’s volume rather than buying on price alone, since an undersized purifier will run constantly and still underperform.
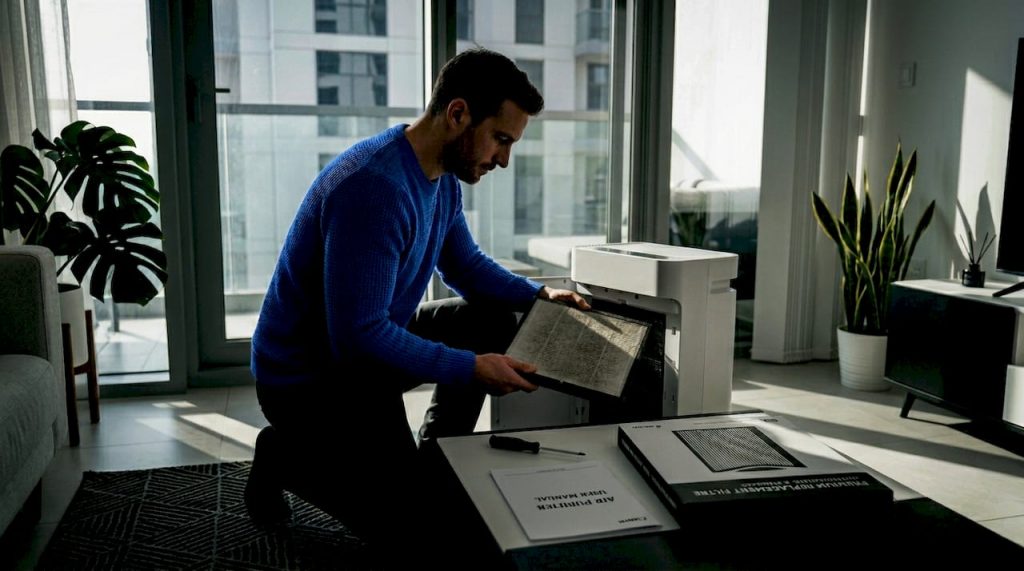
- Maintain filters on schedule. Genuine replacement filters, changed on the manufacturer’s recommended cycle, keep capture efficiency where it should be. A clogged filter restricts airflow without improving filtration.
- Ventilate when outdoor air is genuinely cleaner. On low-pollution days, open windows to dilute indoor sources; on high-pollution or dusty days, seal up and rely on filtration instead.
Pro Tip: Watch your indoor monitor for 10 to 15 minutes after cooking or cleaning. A sharp spike that settles quickly usually confirms an indoor source, while a slow-rising baseline points to outdoor infiltration you may need to address separately.
The bottom line on PM2.5 vs PM10
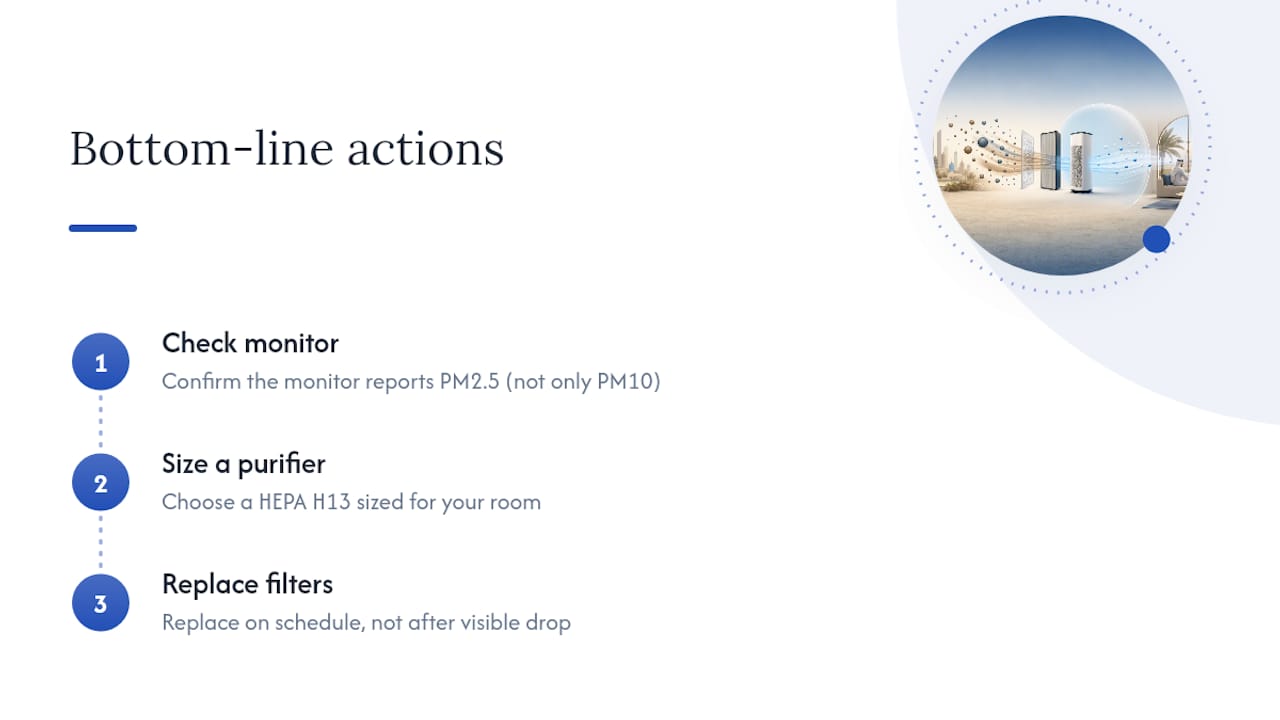
PM2.5 remains the fraction that matters most for long-term health, given how deep it travels into lung tissue and beyond. The practical response is straightforward: check what your indoor monitor is actually reporting, size a HEPA H13 purifier to your room, and replace filters on schedule rather than waiting for performance to visibly drop.
What working with indoor air quality data taught us
Explaining PM2.5 and PM10 in the abstract is one thing. Watching how the numbers actually play out in homes and offices across the UAE is another. Climatepro has helped customers match HEPA H13 purifiers to bedrooms, nurseries, and clinics where dust and traffic pollution are a daily reality, and the pattern is consistent: readers who understand the size difference between PM2.5 and PM10 make far better decisions about filtration and placement than those chasing a single air quality number without context. Getting the fundamentals right changes what people buy and how they use it.
— Nevel
Choosing the right HEPA purifier for PM2.5 and PM10
Once you know PM2.5 is the fraction doing the most damage, the filtration question becomes concrete: which unit actually captures it, and is it sized correctly for the room. Climatepro stocks HEPA H13 rated purifiers that are built to capture fine particles at the sub-micron scale where standard filters fall short, alongside coarser dust and pollen in the PM10 range.

Sizing matters more than most people expect. A purifier’s Clean Air Delivery Rate needs to match your room’s volume, not just its floor area, and Climatepro’s catalogue of HEPA air purifiers is organised so you can compare CADR ratings across models like the Honeywell Air Touch P2 before you buy. Filter lifetimes vary by model and usage, so check the manufacturer’s replacement cycle and use genuine replacement filters rather than generic substitutes, which rarely hold H13 capture rates. If you are unsure which model fits your room, Climatepro’s team can help you match capacity to space so you are not paying for more air changes per hour than the room actually needs, or under-filtering a larger living area.
This article is general information, not a substitute for advice from a qualified doctor. Consult a qualified healthcare professional about your own circumstances before acting on anything here.
Sources
- WHO global air quality guidelines: particulate matter (PM2.5 and PM10), ozone, nitrogen dioxide, sulfur dioxide and carbon monoxide
- Particulate Matter (PM) Basics | US EPA
- Inhalable Particulate Matter and Health (PM2.5 and PM10) | California Air Resources Board
- PMC review on particulate matter health impacts